 After learning it is World AIDS Day we decided to research the current AIDS statistics.
 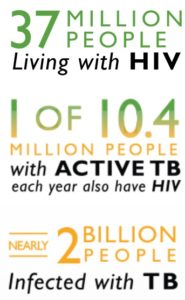 Did you know that HIV and Tuberculosis (TB) are the world’s two most deadly infectious diseases? We had to learn more about this epidemic and what’s is being done to fight AIDS and HIV. We found the best results and more thorough statistics on the Center for Disease Control and Prevention (CDC) site. CDC estimates the number of people living with HIV (called prevalence) by using a scientific model. This model helps CDC estimate the number of new HIV infections and how many people are infected but don’t know it. HIV prevalence is the number of people living with HIV infection at a given time, such as at the end of a given year.
Below are the current statistics for HIV and AIDS broken down by race, sex, geography and year provided by CDC.
Gay and bisexual men are the population most affected by HIV. In 2016:
- Gay and bisexual men accounted for 67% (26,570) of all HIV diagnoses and 83% of diagnoses among males.
- Black/African American gay and bisexual men accounted for the largest number of HIV diagnoses (10,223), followed by Hispanic/Latino (7,425) and white (7,390) gay and bisexual men.
Trends among gay and bisexual men have varied by race. From 2011 to 2015:
- Among white gay and bisexual men, diagnoses decreased 10%.
- Among African American gay and bisexual men, diagnoses increased 4%.
- After years of sharp increases, diagnoses among young African American gay and bisexual men (aged 13 to 24) stayed about the same.
- Among Hispanic/Latino gay and bisexual men, diagnoses increased 14%.
Heterosexuals and people who inject drugs (PWID)f also continue to be affected by HIV. In 2016:
- Heterosexual contact accounted for 24% (9,578) of HIV diagnoses.
- Women accounted for 19% (7,529) of HIV diagnoses (primarily attributed to heterosexual contact [87%, or 6,541] or injection drug use [12%, or 939]).
- PWID accounted for 9% (3,425) of HIV diagnoses (includes 1,201 diagnoses among gay and bisexual men who inject drugs).
By race/ethnicity, African Americans and Hispanics/Latinos are disproportionately affected by HIV. In 2016:
- African Americans represented 12% of the population, but accounted for 44% (17,528) of HIV diagnoses. African Americans have the highest rate of HIV diagnoses compared to other races and ethnicities.
- Hispanics/Latinos represented 18% of the population, but accounted for 25% (9,766) of HIV diagnoses.
From 2011 to 2015:
- In 2014, among all adults and adolescents living with HIV (diagnosed or undiagnosed):
- 62% received some HIV medical care,
- 48% were retained in continuous HIV care, and
- 49% had achieved viral suppression (having a very low level of the virus).
- An estimated 1.1 million people in the United States were living with HIV at the end of 2015.
- In 2014, there were an estimated 37,600 new HIV infections which is down from 45,700 in 2008.
- The annual number of new diagnoses declined by 5% from 2011 to 2015.
- Diagnoses among all women declined 16%.
- Among all heterosexuals, diagnoses declined 15%, and among PWID, diagnoses declined 17%.
- About 15%, or 1 in 7, did not know they were infected.
- In the United States, 6,721 people died from HIV and AIDS in 2014.
- In 2014, it was the 8th leading cause of death for those aged 25-34 and 9th for those aged 35-44.
- There were 162,500 (15%) people had not received a diagnosis.
In 2016:
- A reported 1.8 million new cases of HIV in 2016.
- About 36.7 million people were living with HIV around the world in 2016.
- 5 million of them were receiving medicines to treat HIV, called antiretroviral therapy (ART).
- Estimated 1 million people died from AIDS-related illnesses in 2016. Sub-Saharan Africa, which bears the heaviest burden of HIV and AIDS worldwide, accounts for about 64% of all new HIV infections.
- In 2016, 39,782 people received an HIV diagnosis.
HIV diagnoses are not evenly distributed geographically. The population rates (per 100,000 people) of people who received an HIV diagnosis were highest in the South (16.8), followed by the Northeast (11.2), the West (10.2), and the Midwest (7.5).
If you got through this entire post of statistics your mind is probably as boggled as mine was. I have a personal interest in the numbers as I worked for an organization for HIV and AIDS back in 2012. Though there is a decline the epidemic is still out there and as the statics shows we still have new cases of HIV and AIDS annually. Since the early 1980s, 1,232,346 people have received an AIDS diagnosis.
CDC’s Global AIDS website and CDC Fact Sheet: HIV in the United States explains what CDC is doing in the global fight against HIV. The HIV in the United States by Geography is a fact sheet that explains the geography of HIV in the United States. More information on HIV prevalence. For more information on HIV and AIDS please visit: https://www.hiv.gov.
###
Source: CDC’s Global AIDS website, HIV in the United States by Geography, https://www.hiv.gov